Contact us to get a free quote
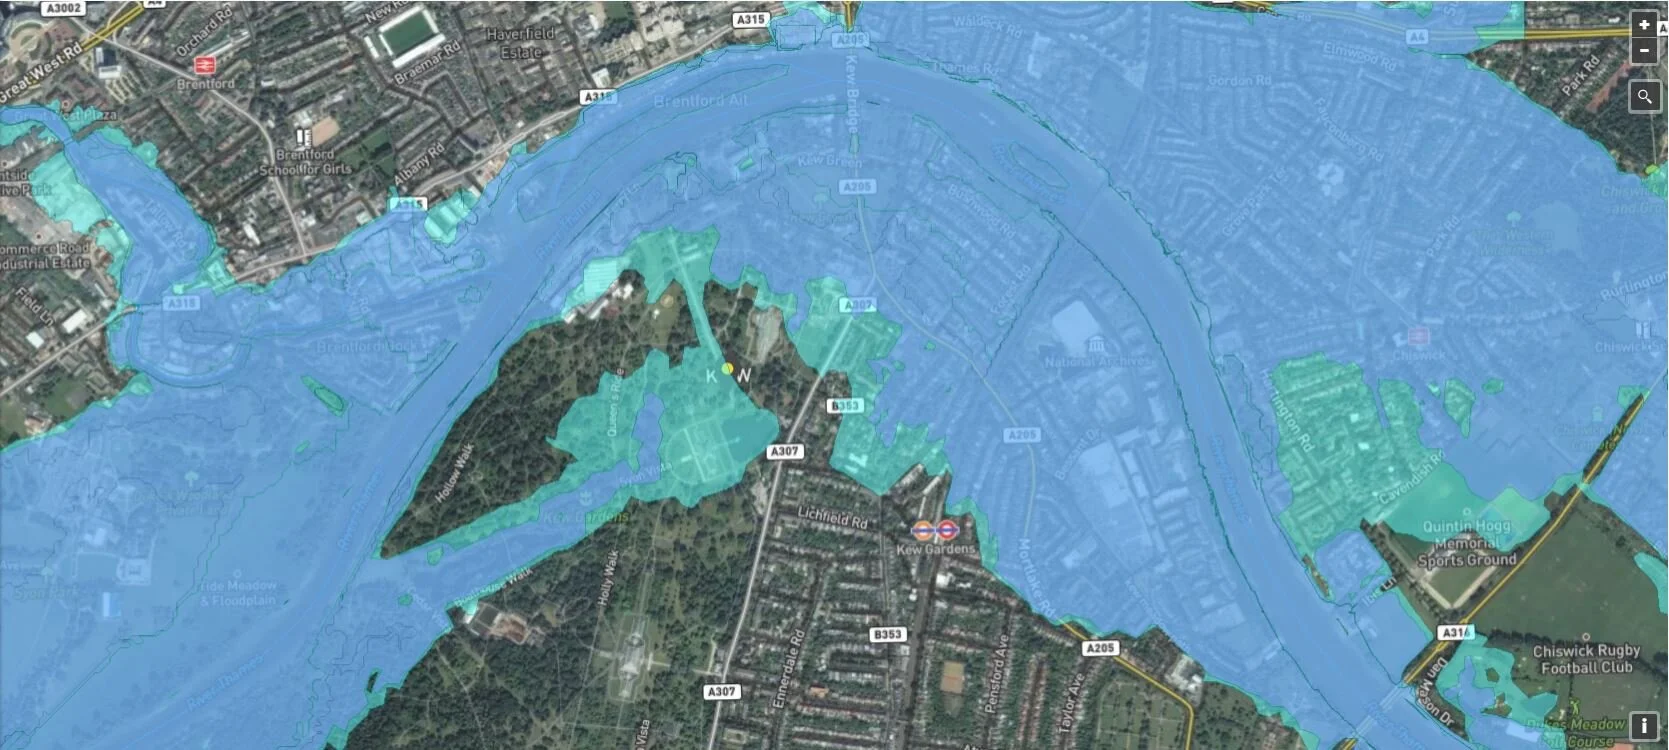
Our Flood map for Planning allows you to interact with different flood data in detail. All flood information at your finger tips
We have created this flood map for planning to help you understand in detail the flood risk that can affect your development.


Key advantages of using our maps:

You are able to change the background of the map
You can use satellite images as map backgrounds
All our maps use a direct input from the Environment Agency databases
You can turn on and off different flood risks without changing screens
It allows to quickly determine your overall flood risk
You will be able to identify the flood zones
Contact us today on 01608 510121 or get a free quote
Our Flood Map
In our flood map for planning, you will be able to see the risk of flooding from rivers or sea (planning), flooding from surface water and reservoirs or whether the development is affected by surface water run-off.
We have taken this information directly from the Environment Agency databases and prepared it so you can check in detail if your development need a flood risk assessment.
If you are uncertain about your requirements, give us a call, we are happy to talk you through the options.

How to use the Flood Map for Planning

The flood zone maps will allow you to initially determine if a more detailed flood risk assessment is required
Although the maps show flood zones for rivers, surface water run-off and other datasets these information is not sufficient to make a detailed assessment on whether an individual property is at risk of flooding
Our maps are created so you can have as much information to make informed decisions on you development
You can read below what each layer of the map represent. This will help you to understand this information in more detail
This video explains how to search the map for different type of flood risk
Contact us today on 01608 510121 or get a free quote
What information is shown on the flood map?

The following is a summary of information shown on the map and its description
Statutory Main Rivers Map is a spatial (polyline) dataset that defines statutory watercourses in England designated as Main Rivers by Environment Agency. Watercourses designated as ‘main’ are generally the larger arterial watercourses. The Environment Agency has permissive powers, but not a duty, to carry out maintenance, improvement or construction work on designated main rivers. Follow the link above to read more.
The Flood Map for Planning (Rivers and Sea) includes several layers of information. This dataset covers Flood Zone 2 &3.
This dataset is designed to support flood risk assessments in line with Planning Practice Guidance ; and raise awareness of the likelihood of flooding to encourage people living and working in areas prone to flooding to find out more and take appropriate action.
The information provided is largely based on modelled data and is therefore indicative rather than specific. Locations may also be at risk from other sources of flooding, such as high groundwater levels, overland run off from heavy rain, or failure of infrastructure such as sewers and storm drains. Follow the link above to read more.
This dataset covers Flood Storage Areas. It shows those areas that act as a balancing reservoir, storage basin or balancing pond. Their purpose is to attenuate an incoming flood peak to a flow level that can be accepted by the downstream channel. It may also delay the timing of a flood peak so that its volume is discharged over a longer time interval.
We have assumed that flood storage areas act perfectly and give the same level of protection as when our assessment of the area was carried out. Flood storage areas do not completely remove the chance of flooding and can be overtopped or fail in extreme weather conditions. Follow the link above to read more.
The Flood Map for Planning (Rivers and Sea) includes several layers of information one of which is areas benefiting from defences.
This dataset shows those areas that benefit from the presence of defences in a 1 in 100 (1%) chance of flooding each year from rivers; or 1 in 200 (0.5 %) chance of flooding each year from the sea. If the defences were not there, these areas would flood in a 1 in 100 (1%)/ 1 in 200 (0.5 %) or larger flooding incident. Follow the link above to read more.
The Flood Map for Planning (Rivers and Sea) shows the areas across England that could be affected by flooding from rivers or the sea.
It also shows flood defences and the areas that benefit from them.
The Flood Map is designed to raise awareness among the public local authorities and other organisations of the likelihood of flooding and to encourage people living and working in areas prone to flooding to find out more and take appropriate action.
Historic Flood Map is a GIS layer showing the maximum extent of all individual Recorded Flood Outlines from river, the sea and groundwater springs and shows areas of land that have previously been subject to flooding in England.
Records began in 1946 when predecessor bodies to the Environment Agency started collecting detailed information about flooding incidents, although we may hold limited details about flooding incidents prior to this date.
Contact us today on 01608 510121 or get a free quote
This dataset is not suitable for identifying whether an individual property will flood. GIS layer showing the extent of flooding from surface water that could result from a flood with a 3.3% chance of happening in any given year. This dataset is one output of our Risk of Flooding from Surface Water (RoFSW) mapping, previously known as the updated Flood Map for Surface Water (uFMfSW). It is one of a group of datasets previously available as the uFMfSW
This dataset is not suitable for identifying whether an individual property will flood. GIS layer showing the maximum depth of flooding from surface water that could result from a flood with a 3.3% chance of happening in any given year. The flood depth is grouped into 6 bands. NB: the maximum depth may not happen at the same time as the maximum speed of flow. This dataset is one output of our Risk of Flooding from Surface Water (RoFSW)
This dataset is not suitable for identifying whether an individual property will flood. GIS layer showing the flood hazard rating for flooding from surface water that could result from a flood with a 3.3% chance of happening in any given year. The flood hazard rating is defined as a function of simultaneous depth and velocity and grouped into 4 bands. This dataset is one output of our Risk of Flooding from Surface Water (RoFSW) mapping, previously known as the updated Flood Map for Surface Water (uFMfSW). It is one of a group of datasets previously available as the uFMfSW Complex Package.
This dataset is not suitable for identifying whether an individual property will flood. GIS layer showing the maximum speed of flood flow from surface water that could result from a flood with a 3.3% chance of happening in any given year. The speed is grouped into 5 bands. NB: the maximum speed may not happen at the same time as the maximum depth. This dataset is one output of our Risk of Flooding from Surface Water (RoFSW) mapping, previously known as the updated Flood Map for Surface Water (uFMfSW).

This is the simplified version of the outline Reservoir Flood Map Outline (Extent) as shown on the Environment Agency website. Simplified in this context refers to the fact that unlike the detailed product, individual reservoir flood map extents are not shown separately, and one merged outline shows the maximum flood extent for all reservoir flooding scenarios together.
This is the simplified version of the outline Reservoir Flood Map Outline (Speed) as shown on the Environment Agency website. Simplified in this context refers to the fact that unlike the detailed product, individual reservoir flood map speeds are not shown separately, and one merged outline shows the maximum flood speeds for all reservoir flooding scenarios together.
This is the simplified version of the outline Reservoir Flood Map Outline (Depth) as shown on the Environment Agency website. Simplified in this context refers to the fact that unlike the detailed product, individual reservoir flood map depths are not shown separately, and one merged outline shows the maximum flood depth for all reservoir flooding scenarios together.
The Development Management Procedure Order (2015) requires that the Environment Agency is consulted on developments within Areas with Critical Drainage Problems (ACDPs). This layer displays the geographical coverage of ACDPs across England. Attribution statement: © Environment Agency copyright and/or database right 2016. All rights reserved.
This metadata record is for Approval for Access product AfA256. Flood Risk Areas identify locations where there is believed to be significant flood risk. The EU Floods Directive refers to Flood Risk Areas as 'Areas of Potentially Significant Flood Risk' (APSFR). Flood Risk Areas have been defined by the Environment Agency (main rivers and the sea) and Lead Local Flood Authorities (surface water). Other sources of flooding are not covered. This dataset includes Flood Risk Areas defined for both Cycle 1 (December 2011) and Cycle 2 (December 2018).
Contact us today on 01608 510121 or get a free quote
The Indicative Flood Risk Areas are primarily based on an aggregated 1km square grid Updated Flood Map for Surface Water (1 in 100 and 1000 annual probability rainfall), informally referred to as the “blue square map”. • Cluster Maps – are aggregations of 3km by 3km squares that each contain at least 4 (in Wales) or 5 (in England) touching "blue squares" (i.e. 1km grid squares where one of the thresholds above is exceeded)
Shapefile for Indicative Flood Risk Areas generated using the Environment Agency's Communities at Risk Approach. This information is provided by the Environment Agency for use by LLFAs in their review during 2017 of Preliminary Flood Risk Assessments and Flood Risk Areas under the Flood Risk Areas. it must be used in conjunction with data for Indicative Flood Risk Areas generated by the Environment Agency using the cluster method as well.
The Indicative Flood Risk Areas are primarily based on an aggregated 1km square grid Updated Flood Map for Surface Water (1 in 100 and 1000 annual probability rainfall), informally referred to as the “blue square map”.
This dataset is a component of Indicative Flood Risk Areas
The Indicative Flood Risk Areas are primarily based on an aggregated 1km square grid Updated Flood Map for Surface Water (1 in 100 and 1000 annual probability rainfall), informally referred to as the “blue square map”. This dataset is a component of Indicative Flood Risk Areas (shapefiles)
The Indicative Flood Risk Areas are primarily based on an aggregated 1km square grid Updated Flood Map for Surface Water (1 in 100 and 1000 annual probability rainfall), informally referred to as the “blue square map”. This dataset is a component part of Indicative Flood Risk Areas (shapefiles)
The Indicative Flood Risk Areas are primarily based on an aggregated 1km square grid Updated Flood Map for Surface Water (1 in 100 and 1000 annual probability rainfall), informally referred to as the “blue square map”. This dataset is a component of Indicative Flood Risk Areas (shapefiles)
This is the WMS read-only data file associated with the Groundwater Scoping report part 1 & 2.
When would you get your flood risk assessment?
You will get the initial flood risk assessment in 48hrs of our appointment
We start the discussions with the council right away and with your design team to get the flood risk assessment and drainage strategy completed.
Our flood risk assessments use the latest data sets and information available

Get in touch with us
Call Arge on 01608 510 121 or e-mail him at arge@rida-reports.co.uk
BEng(Hons) MSC CEng MICE MCIWEM C.WEM CEnv