Surface Water Flood Risk and the Flood Map for Planning: What the 2026 Data Update Means for Your Projects
New surface water depth and climate change datasets are now live on the Flood Map for Planning. Here is what planners, developers and architects need to know.
On 28 May 2026, the Environment Agency updated the Flood Map for Planning with new surface water datasets adding climate change extents and banded depth information that were not previously available through the service. For planners, developers and architects working on sites across England, the practical effect is straightforward: the data used to establish surface water flood risk for planning purposes has changed, and assessments need to reflect it.
This post sets out what the new datasets contain, how they differ from what was used before, and what the update means for live and upcoming applications.
What the Updated Service Now Includes
Four surface water datasets are now available through both the Flood Map for Planning (FMfP) service and the Defra Data Services Platform (DSP):
- Surface Water Spatial Planning Extents – Present Day
https://environment.data.gov.uk/dataset/c853dc8c-9371-4a8f-99ea-a1daa023945e - Surface Water Spatial Planning Extents – Climate Change
https://environment.data.gov.uk/dataset/c5ac51b0-be1d-462a-b734-2c22625ce005 - Surface Water Spatial Planning Depths – Present Day
https://environment.data.gov.uk/dataset/fa3a36ed-121c-424b-b8bf-8108f959b7a9 - Surface Water Spatial Planning Depths – Climate Change
https://environment.data.gov.uk/dataset/cf8d4e8f-99b6-4e5d-bf56-7f80e93d0931
Present day extents were already part of the service. The additions are the climate change extents and, most significantly, banded depth information for both scenarios.
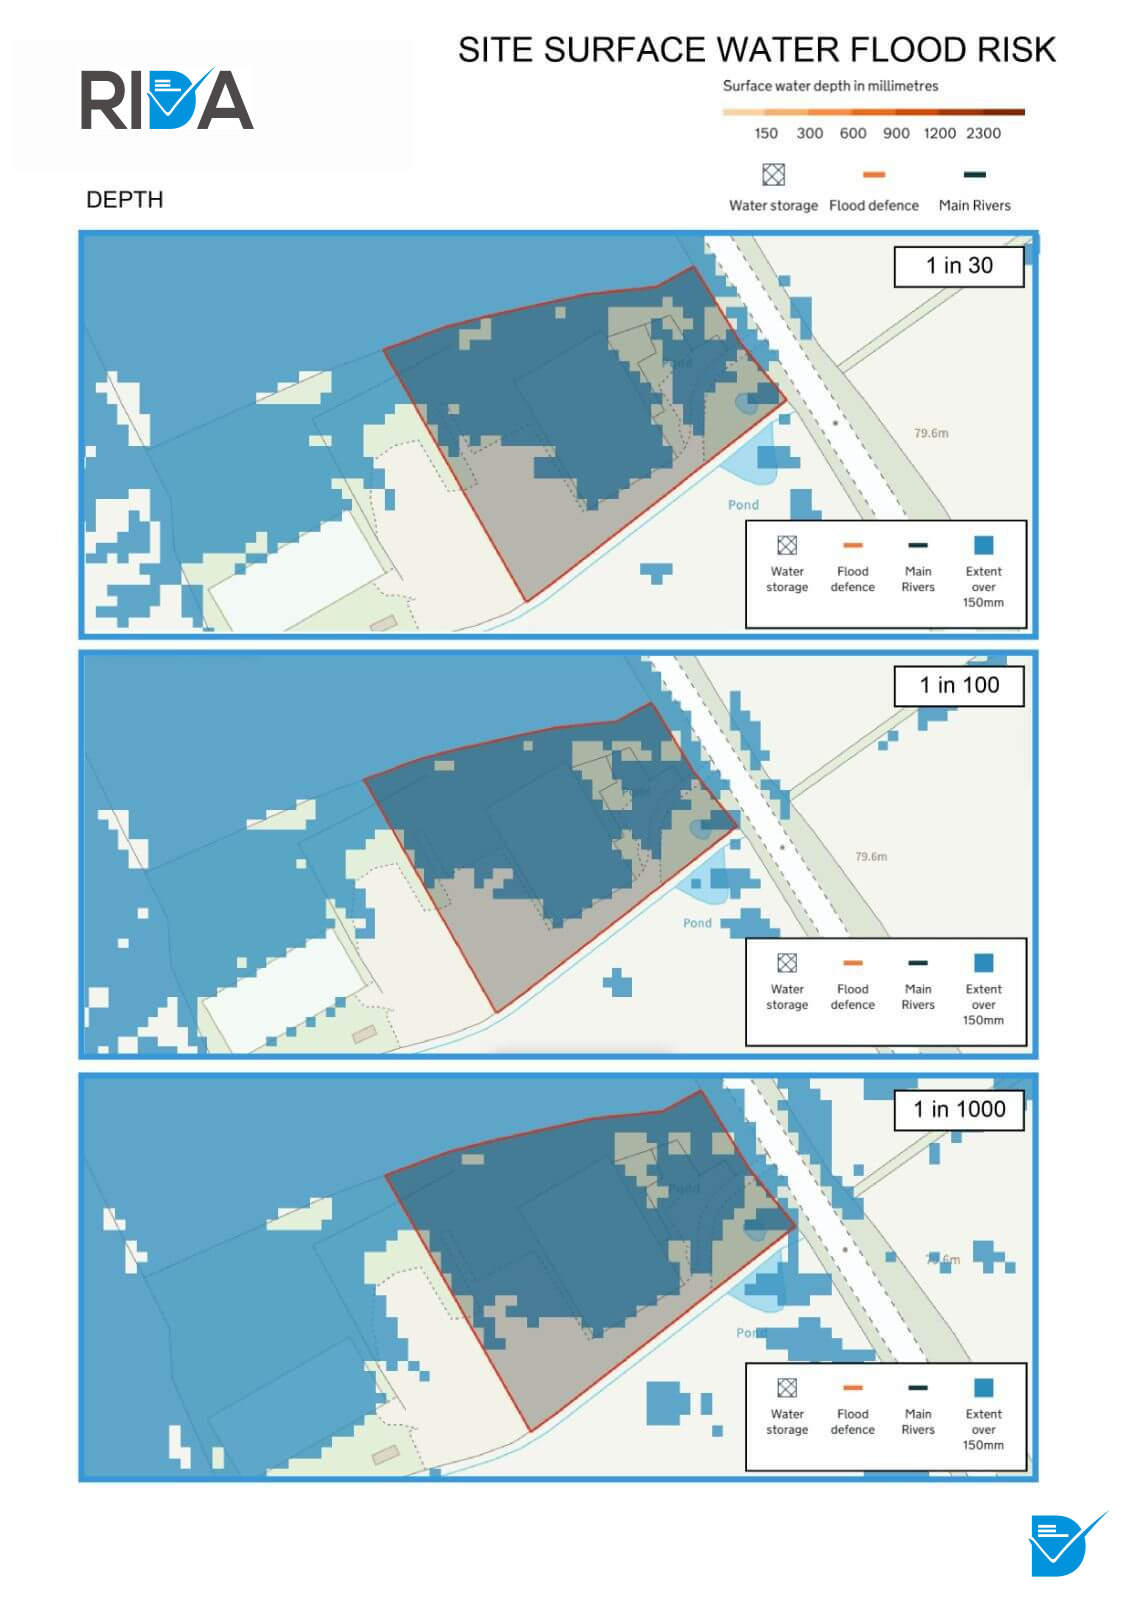
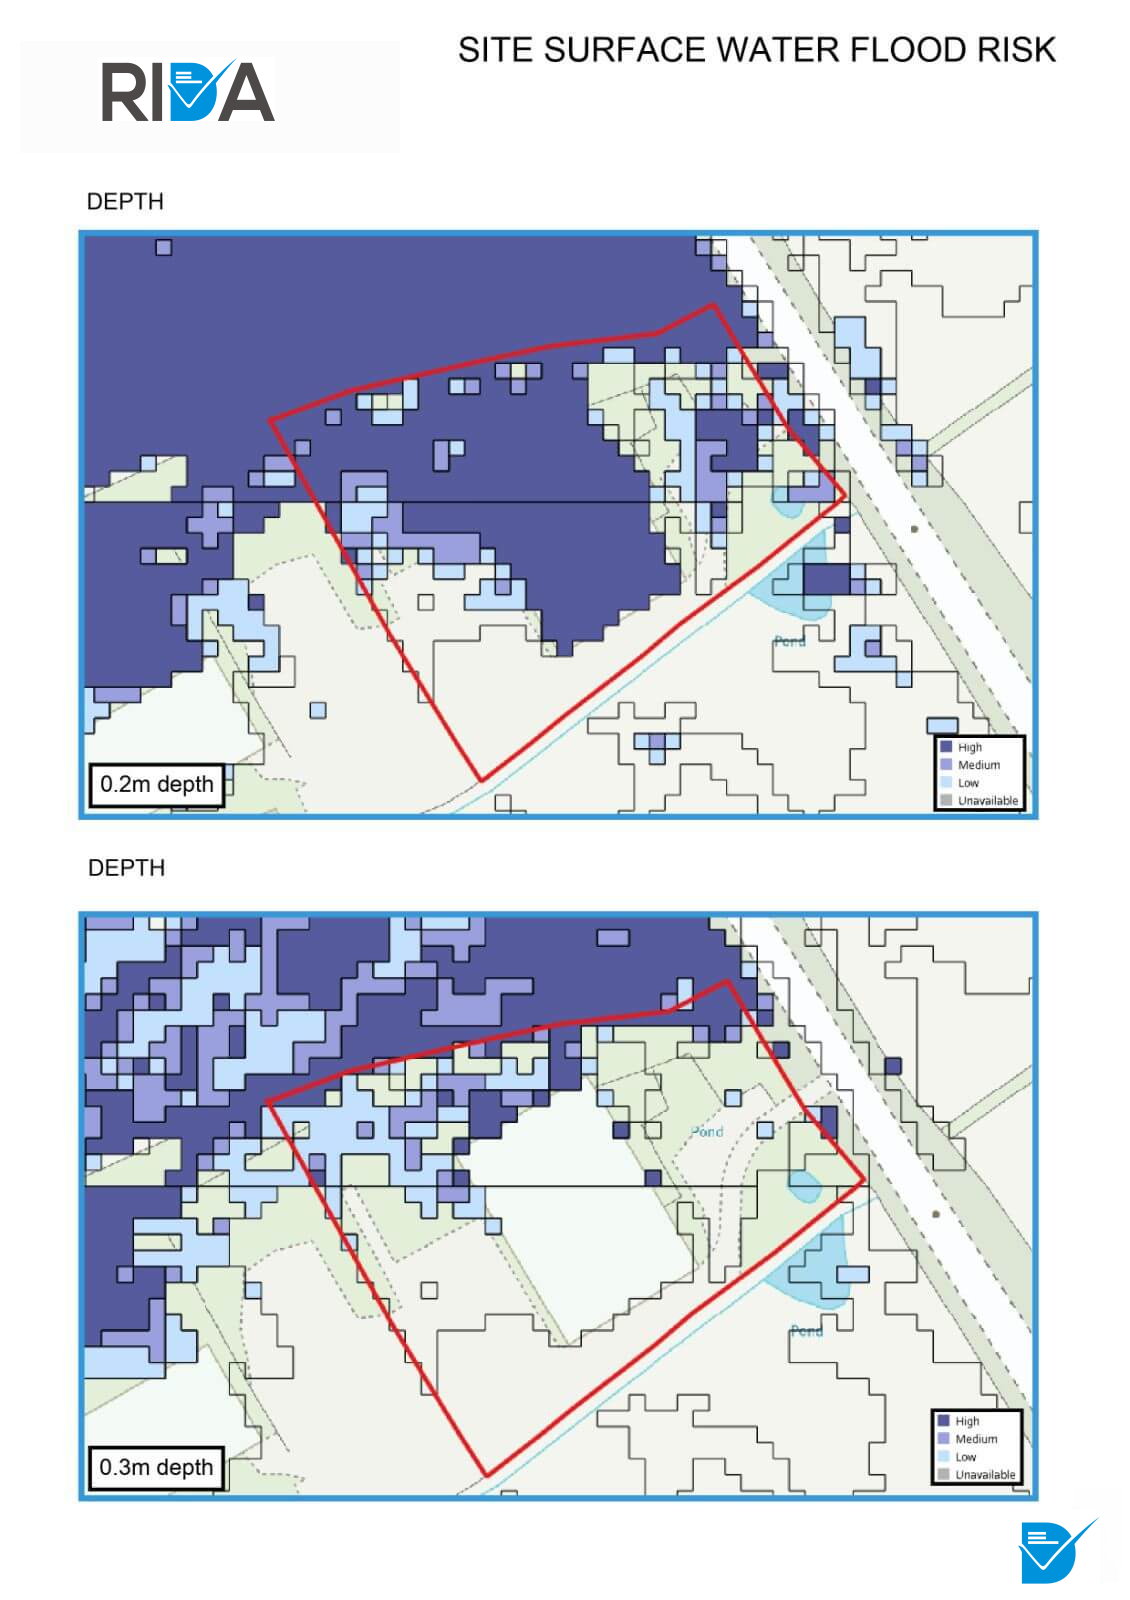
Depth data is categorized across seven bands: under 150mm, 150–300mm, 300–600mm, 600–900mm, 900–1,200mm, 1,200–2,300mm, and over 2,300mm. This gives design teams nationally consistent data on flood severity not just the spatial extent of flooding, but how deep it is which is directly relevant to finished floor levels, SuDS design, and detailed flood risk assessments.
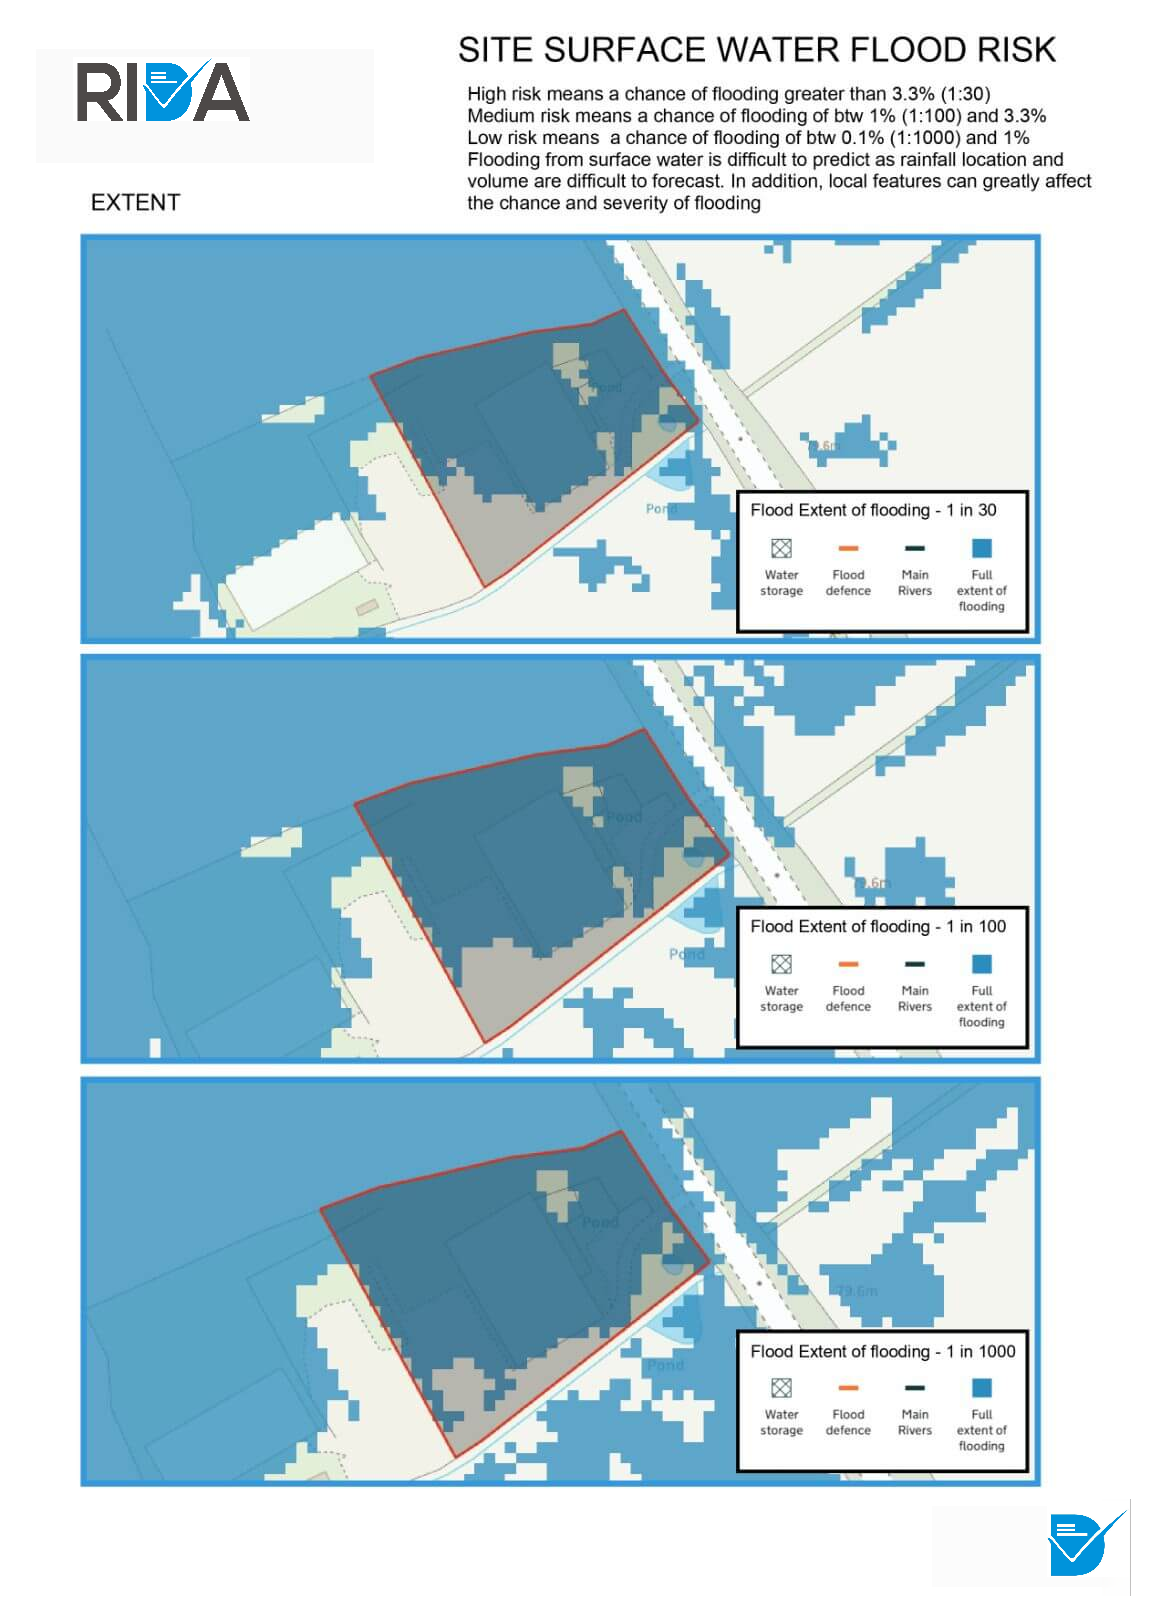
The datasets cover three annual exceedance probability (AEP) scenarios: 0.1% (1 in 1,000), 1% (1 in 100), and 3.3% (1 in 30) the standard return periods applied in flood risk assessments and sequential testing across England.
Why the Previous Data Source Falls Short for Planning Purposes
Before this update, when the FMfP lacked surface water detail, professionals were directed to the Check Your Long Term Flood Risk (CYLTFR) service. That approach worked as a stopgap but carried notable limitations for planning use.
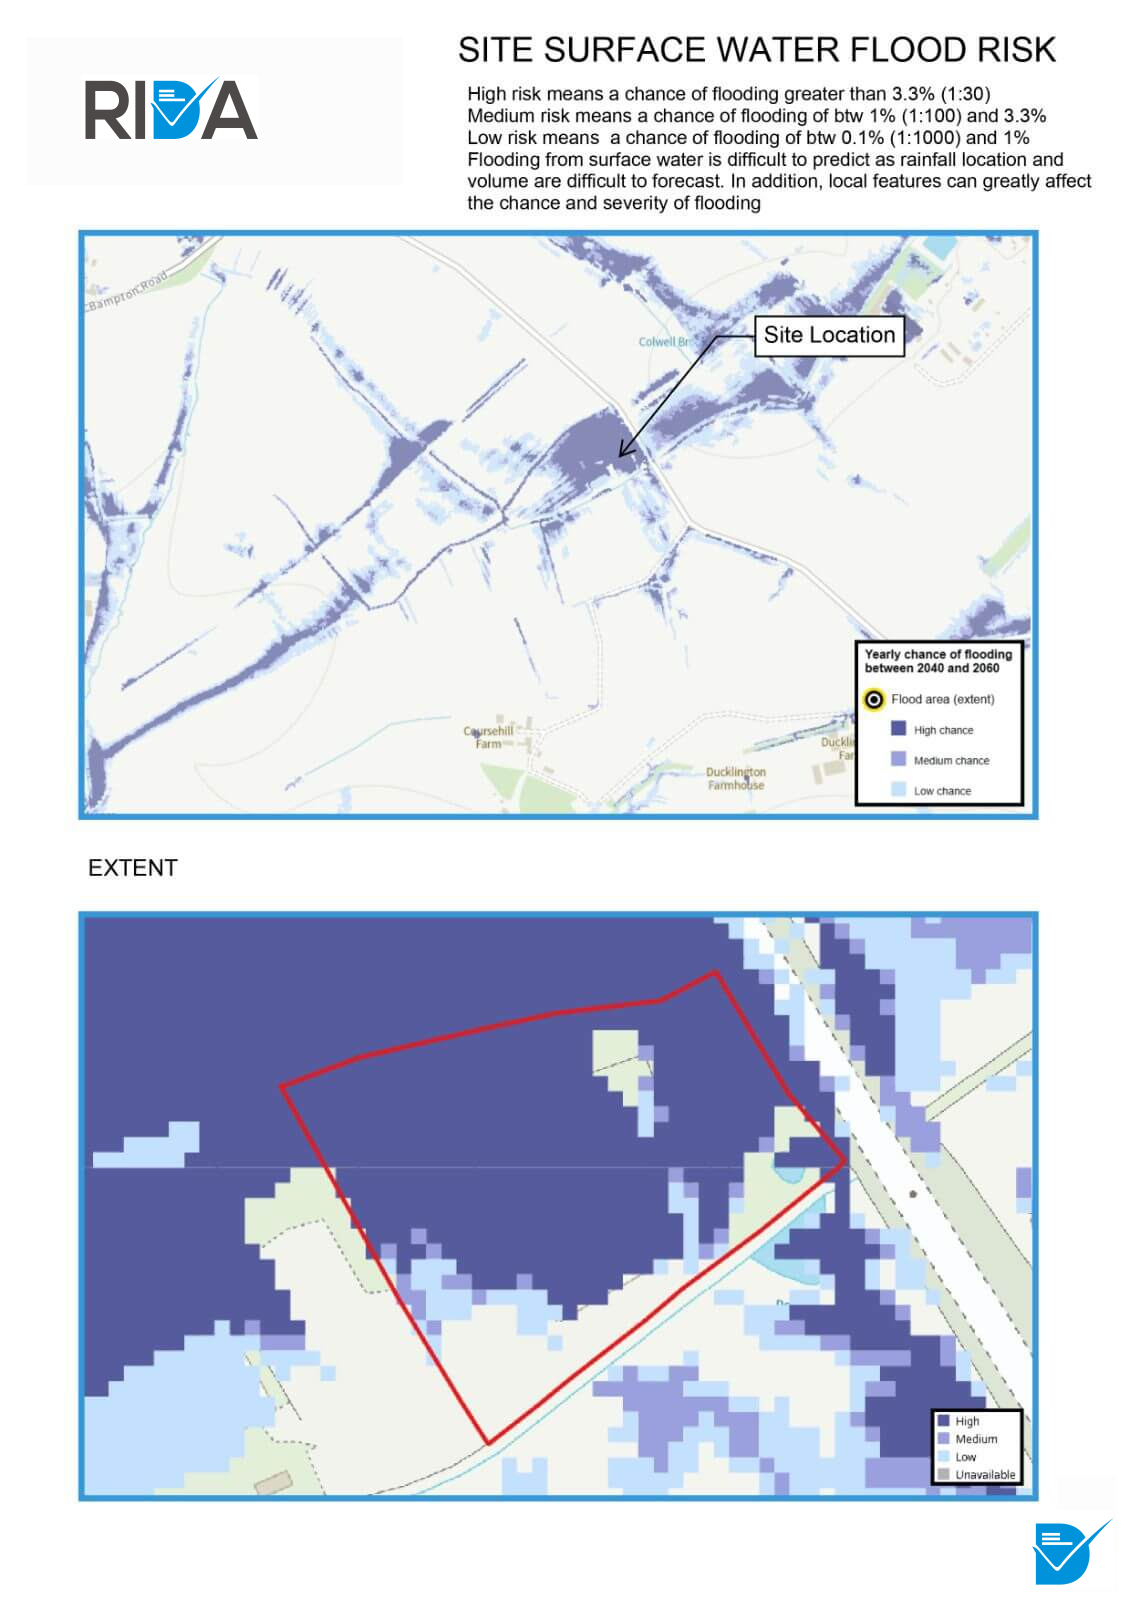
CYLTFR applies a central (50th percentile) climate change scenario for the 2050s epoch (2040–2060). Most planning applications require the upper end (95th percentile) for the 2070s epoch (2061–2125), in line with the Environment Agency's flood risk assessment climate change allowances. The gap between these two scenarios is material, and CYLTFR does not meet the standard of precaution expected for the majority of development types.
On depth data, CYLTFR provided nothing usable for planning. Without design flood depth information, it could not support SuDS strategies or detailed flood risk assessments in the way that the new FMfP datasets now can.
How the Datasets Are Constructed
The datasets combine nationally produced flood model outputs with locally produced detailed models from Lead Local Flood Authorities (LLFAs). Where a LLFA has developed a higher-resolution model, that data takes precedence. The result is a nationally consistent product that reflects the best available information at each location.
One technical point worth noting: depths below 75mm are excluded from the outputs. Surface water modelling typically produces widespread shallow inundation across a catchment. Below this threshold, flooding is generally considered unlikely to prevent access or cause property-level damage, so filtering it out keeps the dataset focused on flood risk that is meaningful for planning decisions.
The climate change scenarios draw on UK Climate Projections (UKCP18) from the Met Office, using Representative Concentration Pathway (RCP) 8.5. The 95th percentile for the 2070s epoch (2061–2125) has been applied an appropriately precautionary horizon for development decisions that will determine the performance of built assets for generations.
Practical Implications for Live and Upcoming Applications
The Environment Agency's guidance is to adopt the new datasets immediately. For planning teams, that means three practical steps.
Update your GIS layers
Add the new surface water datasets from the DSP to your standard development planning toolkit. Live data feeds from the platform are recommended these update automatically and remove the risk of working from outdated downloads.
Retire the CYLTFR surface water layers
Two layers should be removed from planning workflows:
- Risk of flooding from surface water – present day extents and depths
- Risk of flooding from surface water – climate change extents and depths
Review applications in progress
Sites that previously fell outside any surface water flood risk extent may now fall within one under the updated datasets. Where that is the case, a flood risk assessment or sequential test may be triggered. Assessments, sequential tests, and SuDS strategies already prepared or submitted should be checked against the new data and revised where necessary.
Understanding the Scope and Limits of the Data
The new datasets represent a significant step forward in the quality of nationally available surface water data, but they have defined boundaries that matter for how they are used.
They record flood risk to areas of land, not to individual properties. Property-level risk depends on site-specific factors ground levels, finished floor levels, construction type, threshold heights that a spatial dataset cannot capture. A site falling within a flood risk extent does not automatically mean that every structure on it will be at risk.
The datasets address surface water flooding only. River flooding, tidal and coastal flooding, groundwater flooding, and drainage infrastructure failure blocked drains, surcharging sewers, overloaded storm drainage systems are separate flood sources not reflected in this data. A complete picture of flood risk for any site requires assessment across all applicable sources.
Where to Find the Data
The datasets are accessible through two channels.
The Flood Map for Planning service provides an interactive layered map accessible by postcode, place name, or coordinates, with no account required. The new surface water layers sit alongside Flood Zone data, flood defenses, and water storage areas in a single view.
The Defra Data Services Platform (DSP) provides the datasets in GIS-compatible formats for professional use, including ESRI layer files with recommended symbology. Live data feeds support direct integration into GIS workflows.
How RIDA Can Help
Surface water flood risk sits closer to the center of the planning process than ever before, and the data now available to assess it is more detailed than at any point previously. Interpreting that data correctly understanding what it means for a specific site, what it triggers in planning policy terms, and how to address it is where we can add value.
RIDA works with planners, developers and architects at every stage of the process: from initial site appraisals using the updated FMfP datasets, through sequential and exception testing, site-specific flood risk assessments, SuDS strategies, and drainage strategies that reflect the new depth and climate change information.
If you have a site or application that may be affected by the updated data, or want an early-stage review of how the new datasets interact with your proposals, get in touch with the RIDA team.
Talk to the RIDA Team
Get an early-stage review of how the updated datasets interact with your proposals — no obligation.
Get in touch