- Fastest in the UK: Flood Risk Assessments in 48 Hours .
Flood Risk Map
Check your flood risk using trusted national data and view the interactive flood map for your area. Find your risk.

Years Of Experience
0 +
Check Flood Risk Using Maps, Postcodes & Location Data
Flood risk maps help identify whether an area may be affected by flooding from rivers, surface water, groundwater, or the sea. In the UK, flood risk information is primarily provided through national datasets, including Environment Agency mapping and long-term flood risk maps.
These maps are commonly used to gain an initial understanding of flood exposure by postcode or location. They help identify broad flood risk patterns, indicate which flood sources may be relevant, and support early decision-making for property searches, site appraisal, and planning considerations. While flood risk maps provide valuable screening information, they do not reflect site-specific factors such as ground levels, drainage arrangements, or proposed mitigation measures.
We use nationally available data and professional flood risk expertise to help clients understand flood exposure and identify when further assessment may be required.
Flood Zones, Floodplains & Risk Areas
Flood zone and floodplain maps show how land is classified by river and coastal flood probability and are commonly used to support early planning decisions. A flood map for planning helps identify development constraints and assessment requirements.
Flood Zones
Classify land based on river and coastal flood probability
Floodplains
Show areas that naturally store and convey floodwater
Planning constraints
Help identify flood-related limitations on development
Assessment requirements
Indicate whether further flood risk assessment may be needed
Understanding flood zones
The flooding risk map divides land into Flood Zones based on the likelihood of flooding from rivers and the sea. These zones help explain where flood risk may affect development.
The Official Flood Zones Explained:
Flood Zone 1 – Low Probability
- Less than 0.1% chance of flooding each year
- Generally suitable for most types of development
- A Flood Risk Assessment is not usually required, unless other flood risks exist (e.g. surface water)
Flood Zone 2 – Medium Probability
- Between 0.1% and 1% chance of river flooding per year
- Some development may be allowed
- A Flood Risk Assessment is often required for planning Used to assess vulnerability and apply the Sequential Test
Flood Zone 3 – High Probability
- 1% or greater annual chance of river flooding
- Development is more restricted
- A detailed Flood Risk Assessment is required May require mitigation measures or an Exception Test
Scroll down for a map visualization
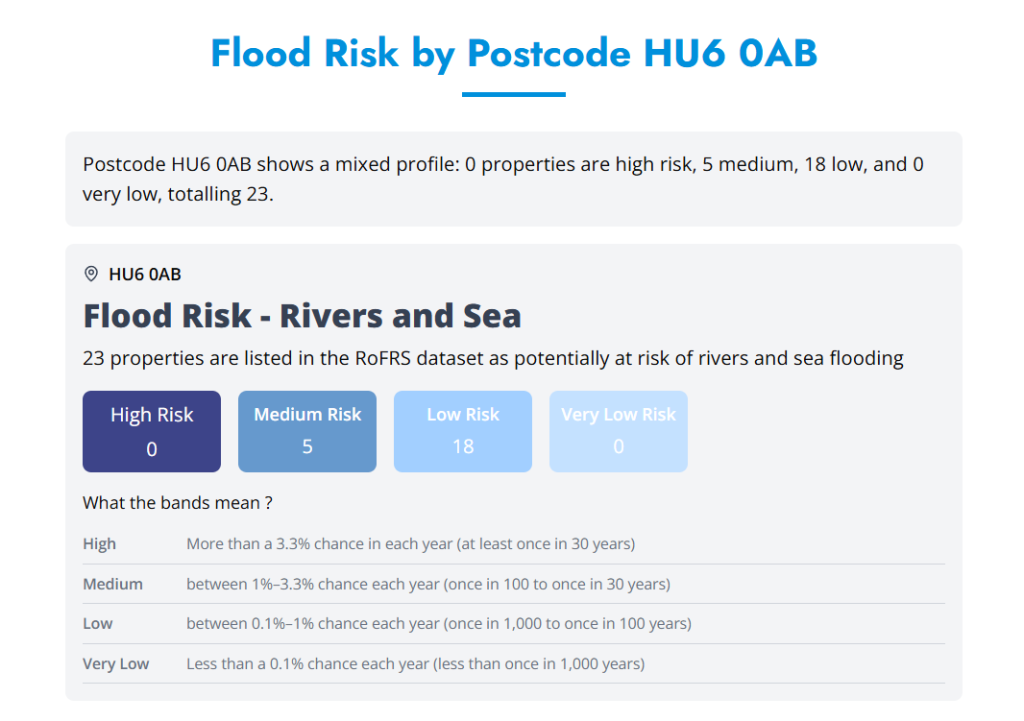
Flood Risk Rivers and Sea
- High
- Medium
- Low
- Very Low
- Unaivailalable
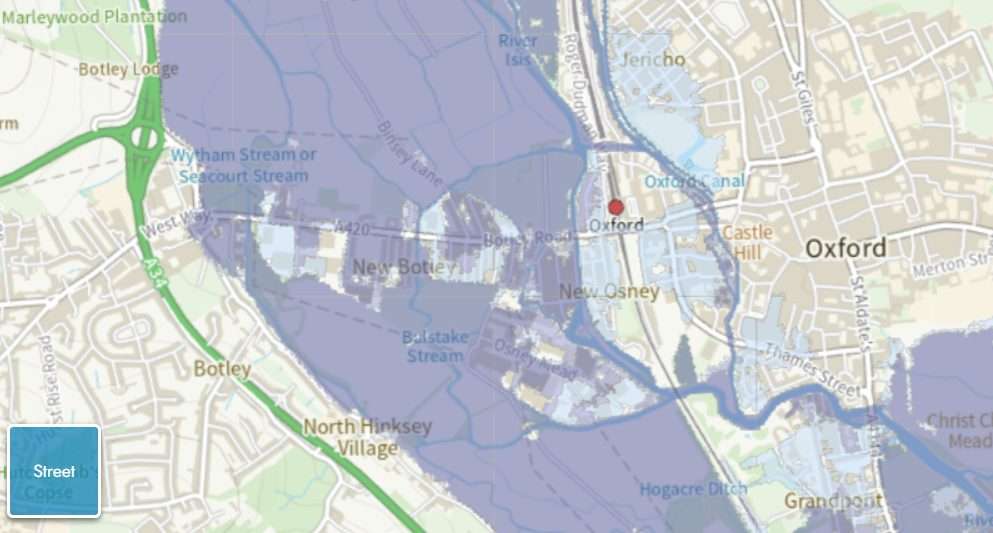
Flood Risk Map by Postcode
Most people start by asking a simple question: Is my property or site at risk of flooding?
Understanding flood risk is not only about current conditions, but also about how exposure may change over time due to long term flood risk factors such as climate change and future development.
By entering a postcode, you can:
- Identify whether a location sits within a mapped flood risk area
- See broad flood extents and zones affecting the surrounding area
- Understand whether further investigation may be required
For development sites and planning applications, this initial screening is commonly carried out using a postcode-based flood map.
You can also check the following maps
- Flood Maps England: Environment Agency Flood Map for Planning
- Scotland: Scottish Environment Protection Agency flood maps
- Wales: National Resources Wales flood map
- Northern Ireland: Flood maps (NI)
Environment Agency Flood Maps
In England, Environment Agency flood maps provide the national strategic baseline for flood risk information and are a core reference within the National Planning Policy Framework (NPPF) and Planning Practice Guidance (PPG). These datasets are routinely used by local planning authorities to apply the Sequential Test and inform early-stage planning decisions.
Environment Agency flood maps define:
- The applicable flood zone (Flood Zones 1, 2 and 3) for rivers and sea flooding
- Areas at risk of surface water flooding
- Recorded historic flood events, where available
Surface Water and Groundwater Flood Risk
Many flood incidents occur outside mapped river flood zones, particularly during periods of heavy or prolonged rainfall.
Surface water flooding occurs when rainfall runoff exceeds the capacity of drainage systems, causing water to accumulate on streets, land, and around buildings.
Groundwater flooding happens when underground water levels rise and emerge at the surface or into basements, especially in areas with permeable ground conditions. More information is available in Groundwater Flooding
Historic flood records are used to identify locations that have flooded in the past and may be vulnerable to similar events in the future.
When Are Flood Risk Maps Not Enough?
Flood zone maps provide an initial overview of flood risk and are commonly used at an early stage. However, flood risk maps have limitations and do not account for site-specific conditions such as ground levels, existing drainage, finished floor levels, or proposed development layouts.
Flood maps may not be sufficient when:
- A planning application is being submitted
- A property sits close to a mapped flood boundary
- Surface water or groundwater risk is present
- Insurers, lenders, or solicitors require clarity
- Insurers, lenders, or solicitors require clarity
- Development could alter drainage or flood pathways
When this happens, a formal report is often required.
What’s Your Next Step After Checking Flood Risk?
Use flood risk maps to understand exposure and then choose the right level of reporting to move forward with confidence.

I Need a Simple Planning or Property Statement
Best for:
- Homeowners
- Low-risk sites
- Early planning checks
Reports:
- Flood Risk Statement
- Low-risk Flood Risk Assessment
I’m Submitting a Planning Application
Best for:
- House extensions
- New dwellings
- Change of use
Reports:
- Planning-ready Flood Risk Assessment
- Site-specific assessment with mitigation
I Need a Detailed Technical Assessment
Best for:
- Larger or complex sites
- Significant flood constraints
- Planning objections or scrutiny
Reports:
- Flood Risk Appraisal
- Detailed Flood Risk Assessment
Not sure which report applies to your site? We’ll review your flood risk and advise on the correct report before you commit.
Our Clients


Additional Flood Risk Services
Alongside our Flood Risk Map, we provide specialist flood risk services to support Flood Risk Assessments where more detailed analysis is required.
What Our Customer Says
James Cogley Cogley Structural Solutions
We have had the pleasure of working with Arge at RIDA over several years and throughout this time the experience has consistently been very good. What stands out most is their responsiveness - any queries or issues have always been addressed promptly, which has given us great confidence and peace of mind.
Jon Lipka M&E Design and Build Ltd
Frequently Asked Questions
Most flood maps use a simple colour progression where the darker shades of blue or warmer colours indicate a higher risk or probability of flooding, while lighter shades or clear areas represent lower risk.
General Risk Levels and Colors
- High Risk (Dark Blue): These areas have the greatest likelihood of flooding (e.g., a 1% annual chance or greater, known as the 100-year floodplain).
- Medium/Moderate Risk (Medium Blue): These areas have a moderate chance of flooding (e.g., a 0.2% annual chance, or areas between the 100-year and 500-year floodplains).
- Low/Very Low Risk (Light Blue, Clear, or Unshaded): These areas have a very low chance of flooding (e.g., less than a 0.1% annual chance).
While the Environment Agency's Flood Map for Planning is a starting point, it is usually considered indicative. For high-risk areas, developers often need to purchase "Product 4" data (detailed modeling) or conduct their own hydraulic study.
This product provides more technical detail than the standard public flood maps, including:
- Detailed Flood Map: Showing flood zones, defences, and water storage areas.
- Modelled Flood Levels: Specific flood levels and flows for different return periods (e.g., 1 in 100-year events), often including climate change allowances.
- Flood Defence Information: Locations and attributes of existing flood defences and areas that benefit from them.
- Historic Flood Data: Details and outlines of past flood events in the vicinity of the site.
- Breach Hazard Information: Where available, maps showing maximum flood depth and velocity if a defence were to fail.
How do I get Product 4?
You can request Product 4 directly from the Environment Agency:
1. Use the Flood Map for Planning Service: Visit the Flood Map for Planning and enter your site's postcode or location.
2. Submit a Request: On the development site page, input your contact details (name and email) to request the data.
3. Email Directly: Alternatively, you can email your request to enquiries@environment-agency.gov.uk.
Include a site location map with a clearly marked boundary.
Provide the full address and postcode.
4. Wait for Processing: The Environment Agency typically sends the data package within 20 working days.
If any part of the ""red line"" planning boundary touches Flood Zone 2 or 3, a full, detailed FRA is usually required for the entire application, even if the actual buildings are located in the low-risk Zone 1 area.
Accuracy varies. Some areas use advanced LiDAR and satellite modeling, while others rely on historical data. In the US, studies suggest about two-thirds of stream miles have yet to be mapped by FEMA.
Historical lack of flooding is not a guarantee of future safety. Maps and assessments are based on predictive modeling of extreme events (like a 1-in-100-year storm) that may not have occurred in living memory. Changes in local development and climate can also create risks that never existed before.